-
Product Screenshots
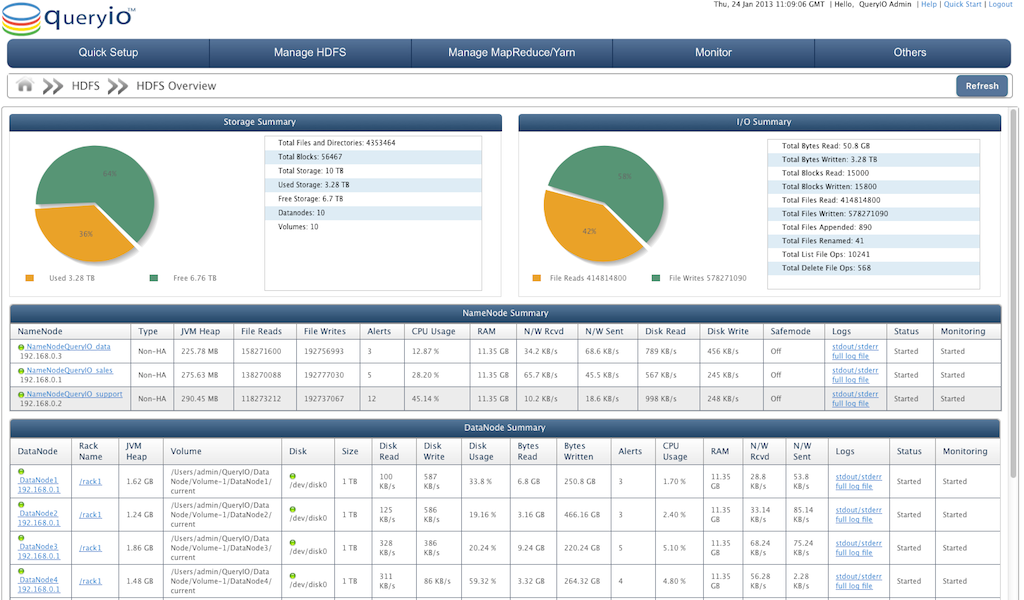
HDFS Overview
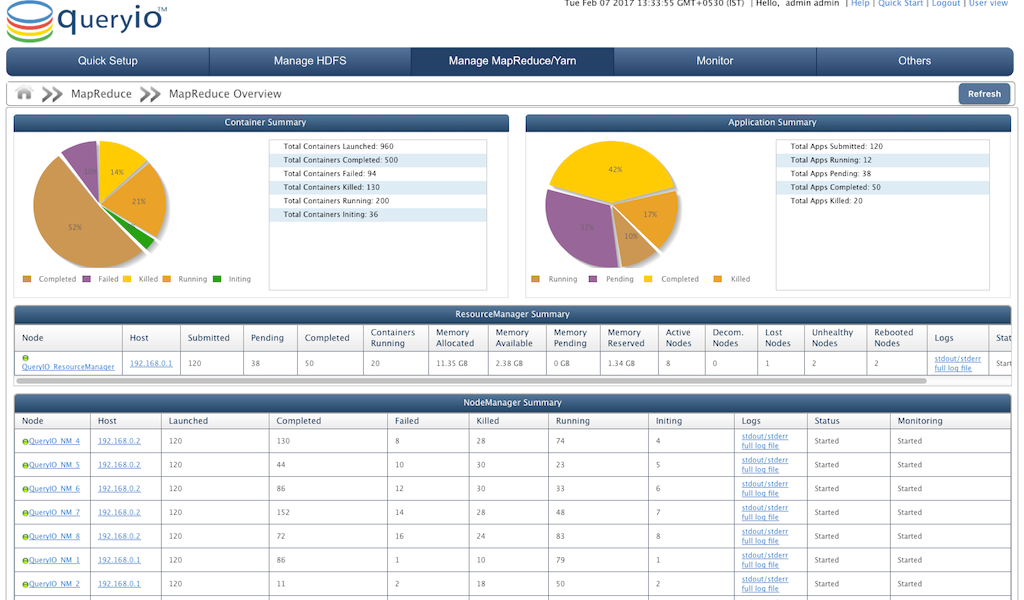
HDFS Overview displays detailed matrix for Hadoop cluster.MapReduce Overview
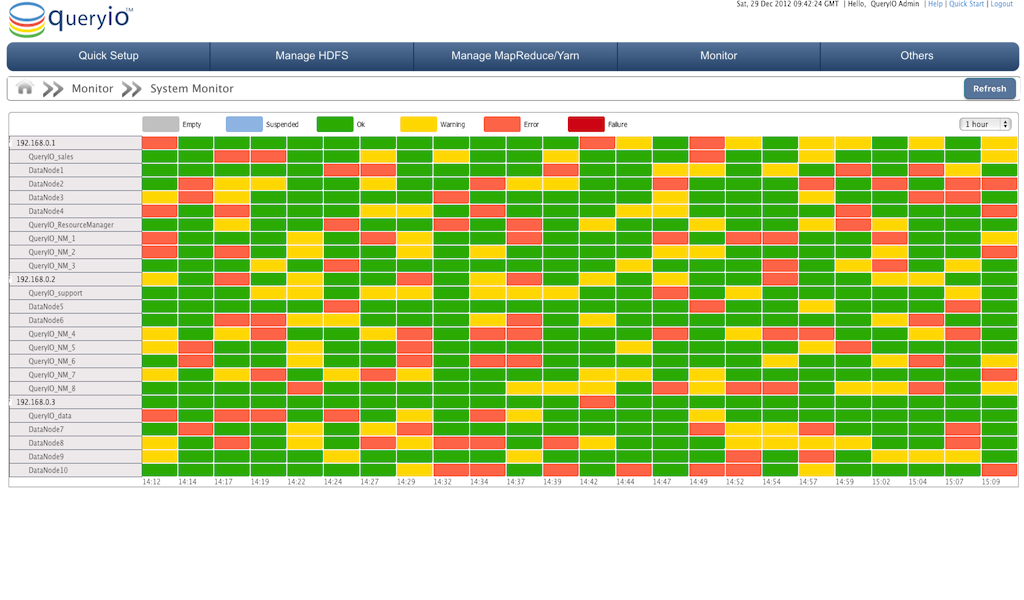
MapReduce Overview displays Hadoop MapReduce cluster management and monitoring data.Status View
It displays status summary of all the Hadoop cluster components. Status view provides a quick color-coded view of the state of the host machines and NameNodes or DataNodes configured on host machines. Status is displayed in a graphical view with nodes against time.Data Browser
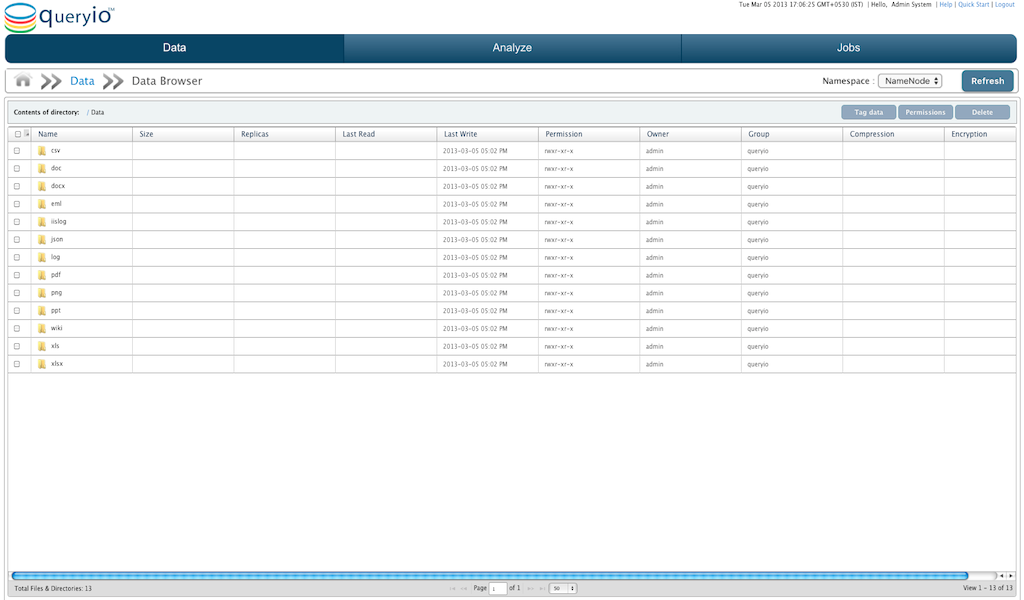
Data Browser is a file explorer. It allows you to access all the directories and files stored in the QueryIO. Files and folders displayed are retrieved from all the DataNodes in the cluster. By default, data browser shows all the files and directories in root directory i.e "/" and allows you to access files or navigate through the directories. Using Data Browser, you can also download files from HDFS to your local file system.Data Migration
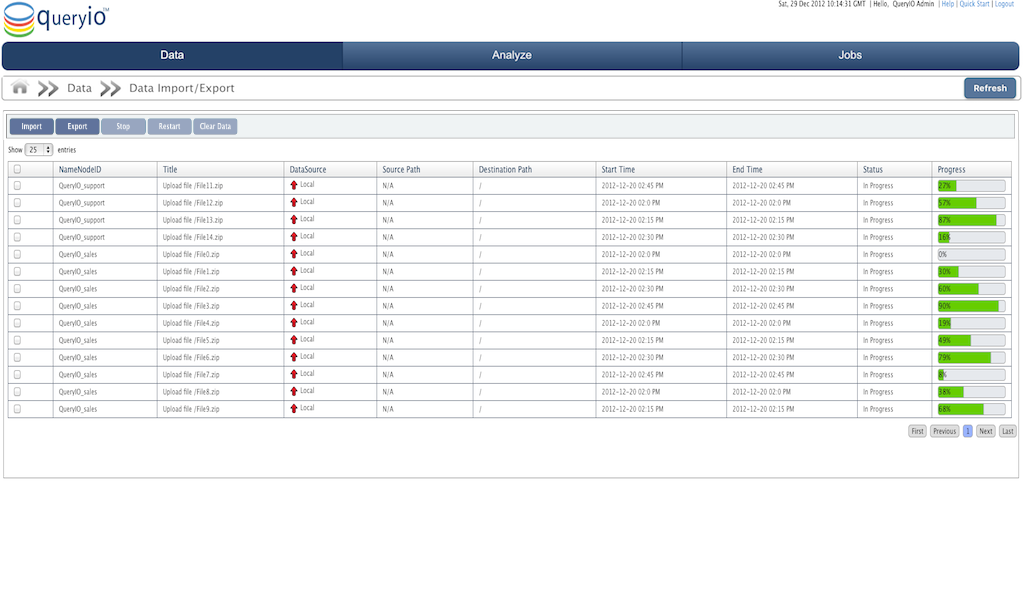
Data migration is the process of transferring data between storage types, formats, or computer systems. Data migration is usually performed programmatically to achieve an automated migration, freeing up human resources from tedious tasks. To achieve an effective data migration procedure, data on the old system is mapped to the new system providing a design for data extraction and data loading.Job Manager
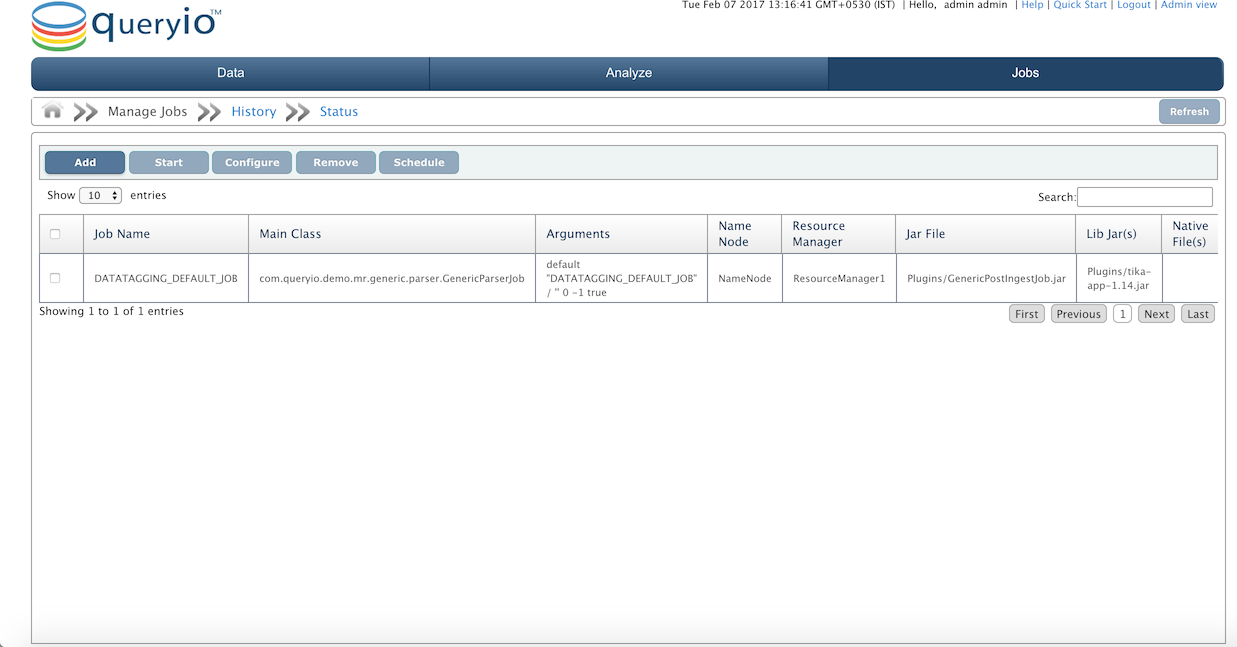
QueryIO provides facility to execute MapReduce application in form of a JAR file. You can submit, execute and perform various operations on MapReduce Jobs.Hadoop SQL Query Designer
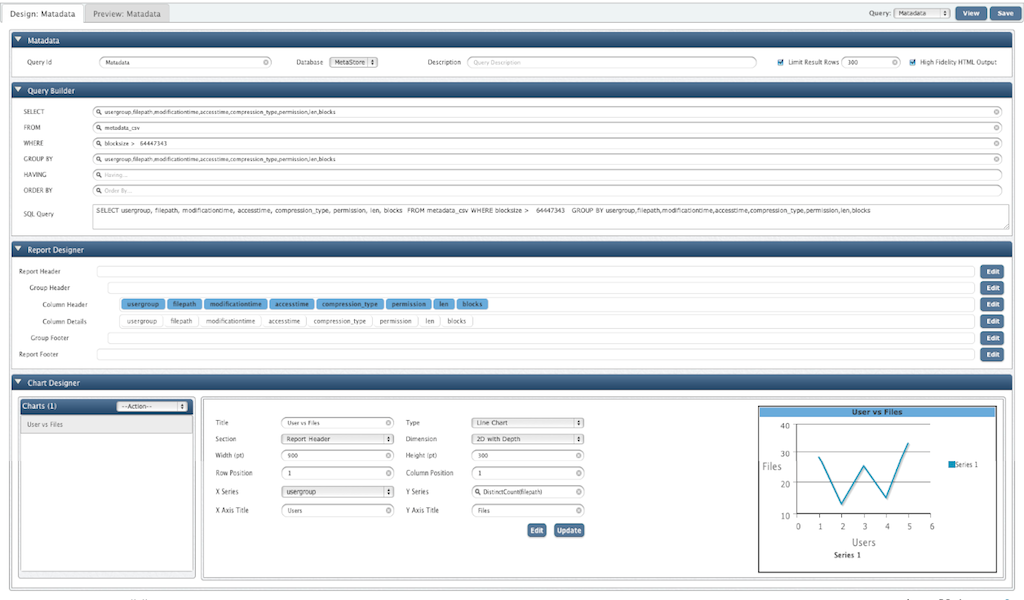
Hadoop SQL Designer is used to design SQL queries for Big data analytics. It allows you to define grouping, sorting and difficult criteria queries in a simple and easy way. Using chart designer interface of QueryIO designer, you can build charts for the processed data to help you with complex data analysis.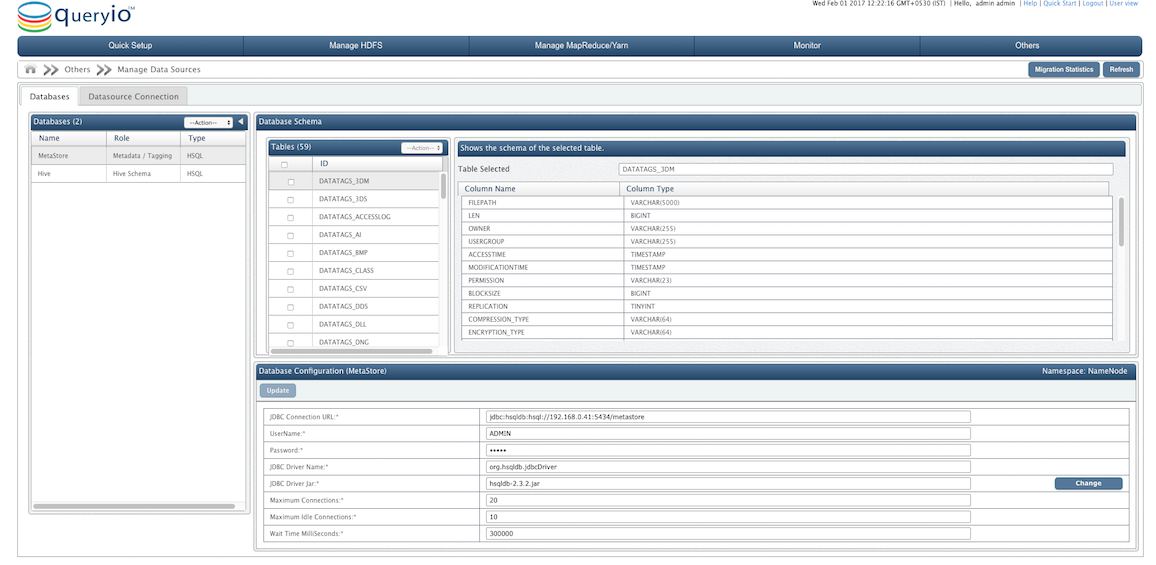 Use Relational Database to store the processed data, metadata / tags for all the files on Hadoop cluster.
Database Manager
Use Relational Database to store the processed data, metadata / tags for all the files on cluster. This enables you to leverage the vast and mature infrastructure built around SQL and relational databases and utilize it for your Big Data Analytics needs. Use Chart Designer to to create charts that will be displayed with result of query viewed in query viewer.
Chart Designing
QueryIO helps you to use charts to obtain graphical representation of your query result. Chart designer is used to create charts that will be displayed with result of query viewed in query viewer. Graphic visual representations of information, data or knowledge presents complex information clearly and effectively.Hive Data Definition
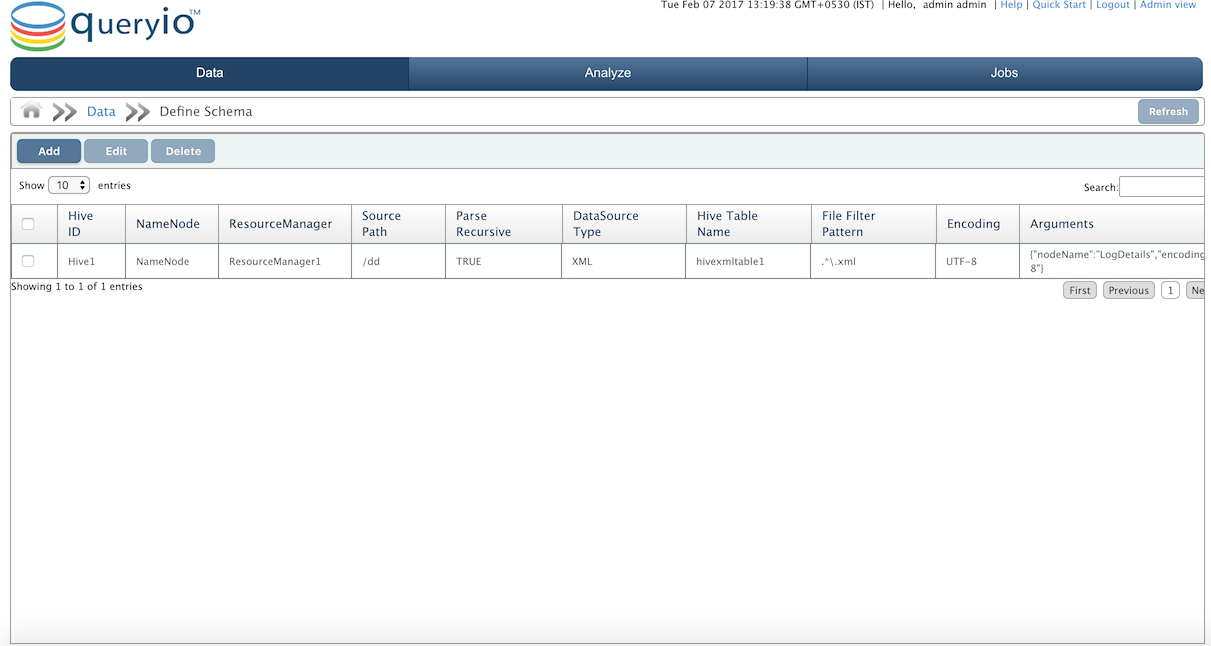
QueryIO provides facility to define the schema for files you need to analyze. Hive will launch a Map Reduce job to analyze and process files on cluster. Results of Hive Queries will be stored in the schema you define here.Data Tagging
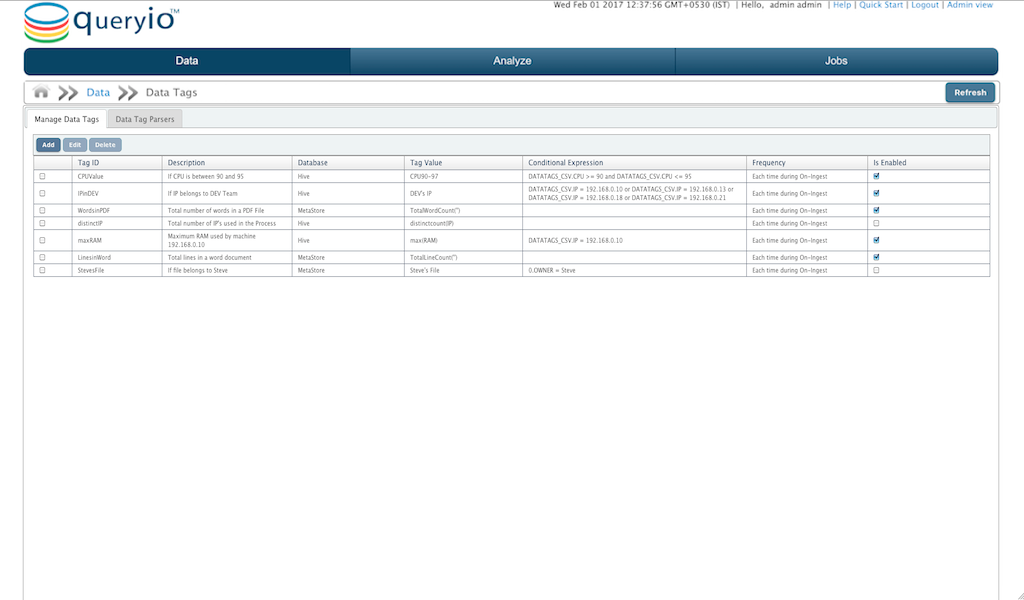
Data tagging helps you to define data tag and operator which should be applied on files on cluster. You can choose to define data tags using the table you have already created using Hive DDL or can choose system defined metastore tables for different file formats. You can also provide expressions to apply tags conditionally on-ingest or on a scheduled time.SpreadSheet Viewer
QueryIO provides support for spreadsheet viewer to process and further analyze the query results. Spreadsheet viewer provides a excel like spreadsheet with all the layers of business intelligence. Spreadsheet viewer allows sheet creation, viewing and editing processes.
Copyright © 2018 QueryIO Corporation. All Rights Reserved.
QueryIO, "Big Data Intelligence" and the QueryIO Logo are trademarks of QueryIO Corporation.
Apache, Hadoop and HDFS are trademarks of The Apache Software Foundation.
QueryIO, "Big Data Intelligence" and the QueryIO Logo are trademarks of QueryIO Corporation.
Apache, Hadoop and HDFS are trademarks of The Apache Software Foundation.


 Facebook
 YouTube
 LinkedIn
 Google+
 Twitter
 SlideShare