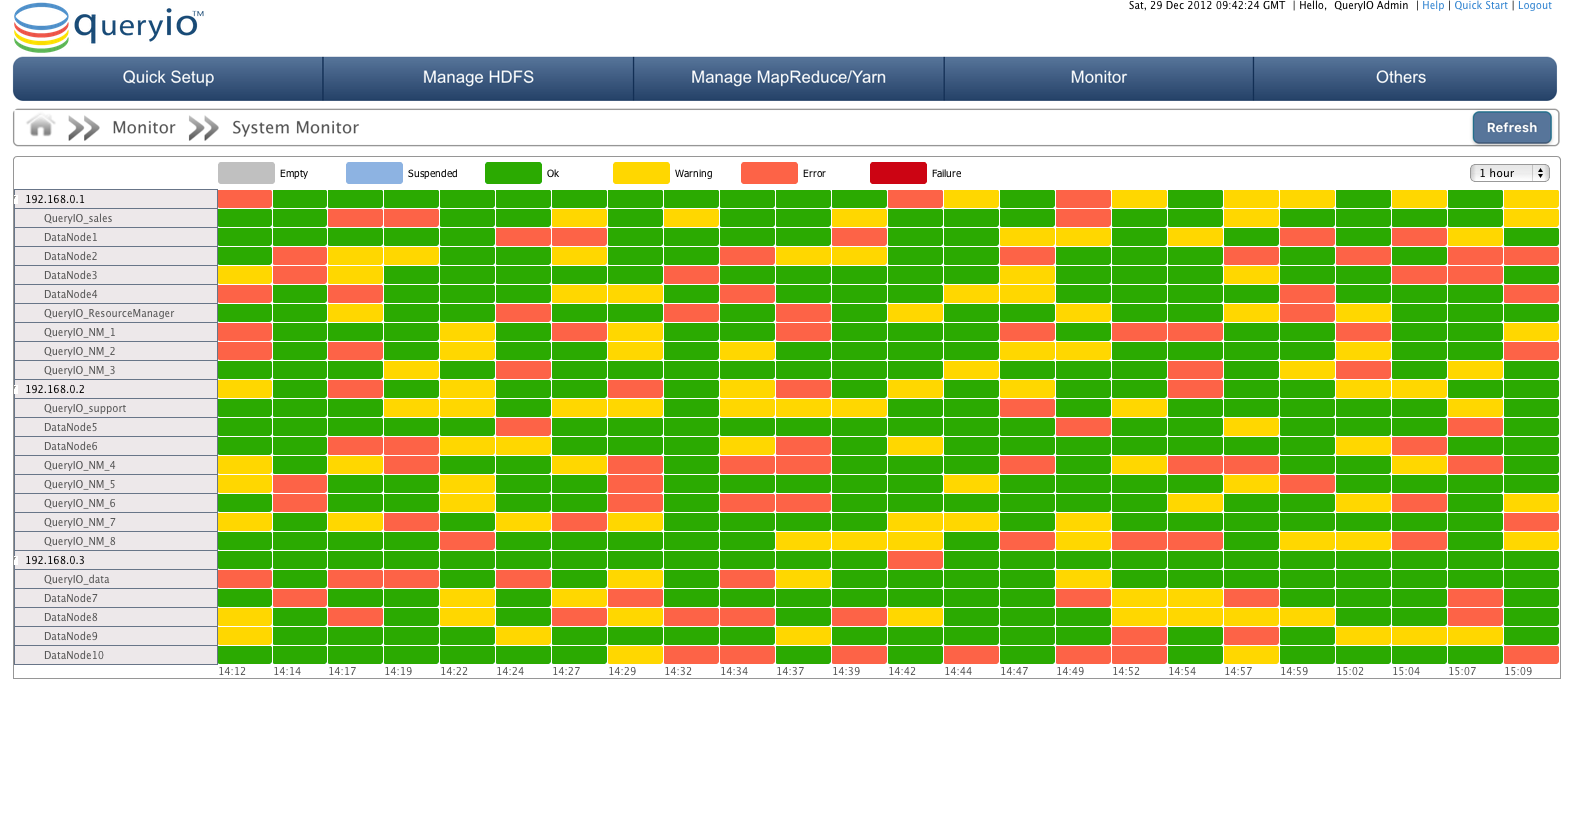
System monitor displays status summary of all the NameNodes, DataNodes, ResourceManagers and NodeManagers in the QueryIO cluster. Status of nodes can be empty, suspended, ok, warning, error or failure.
Status view provides a quick color-coded view of the state of the configured hosts and all the nodes configured on those hosts. Status is displayed in a graphical view with nodes against time. Displayed status time windows can be changed to 1 hour, 1 day, 7 days, 30 days, 90 days, 180 days or 360 days from the drop down menu.

Status of monitors is processed and the result is represented in color-coded cells in the matrix. Color codes are defined as follows:
| State | Color | Description |
| Empty | This state signifies there is no node. | |
| Suspended | The node has been manually suspended. | |
| OK | This status signifies that node is working fine. | |
| Warning | Signifies there is a warning for the node. | |
| Error | Signifies the a error has occurred on node. | |
| Failure | Signifies that node has failed. |
User can also click on Refresh button to get the latest details.