Dashboard - HDFS Overview
In this Chapter
Dashboard shows the monitoring details for QueryIO cluster.
Dashboard displays:
HDFS Overview
The Hadoop Distributed File System (HDFS) is a distributed file system designed to run on commodity hardware. HDFS provides high throughput access to application data and is suitable for applications that have large data sets.
HDFS has a master/slave architecture. An HDFS cluster consists of a single NameNode, a master server that manages the file system namespace and regulates access to files by clients. In addition, there are a number of DataNodes, usually one per node in the cluster, which manage storage attached to the nodes that they run on.
The NameNode executes file system namespace operations like opening, closing, and renaming files and directories. It also determines the mapping of blocks to DataNodes. The DataNodes are responsible for serving read and write requests from the file system’s clients. The DataNodes also perform block creation, deletion,
and replication upon instruction from the NameNode.
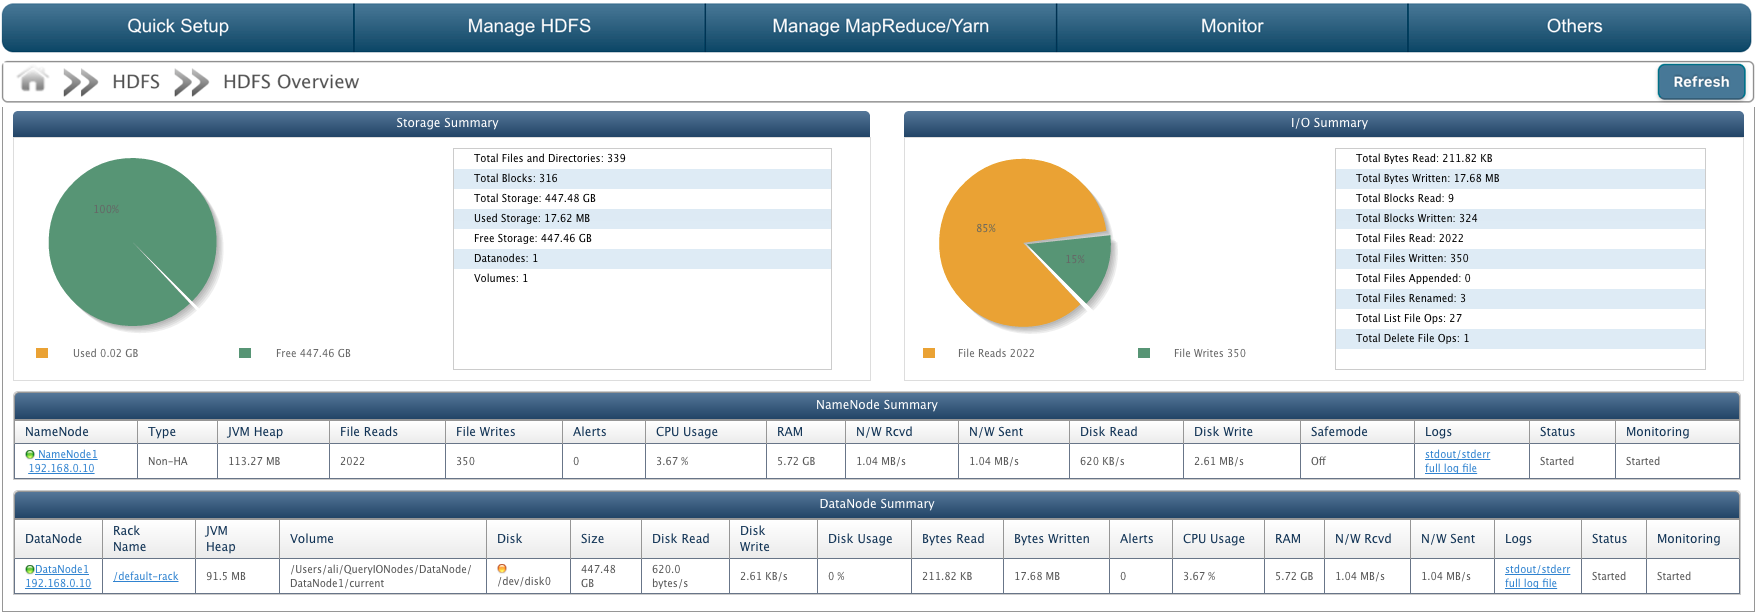
HDFS Overview displays storage summary and I/O summary. It also displays the NameNode summary and DataNode summary.

Storage Summary
Storage summary is gathered from DataNodes. It has a storage pie chart which shows storage space used versus storage space available.
- Total Files and Directories: Total number of files and directories existing on the cluster.
- Total Blocks: Total number of blocks present.
- Total Storage: Total storage space available.
- Used Storage: Amount of storage space used.
- Free Storage: Amount of storage space free to use.
- DataNodes: Number of DataNode from which above data is gathered.
- Volumes: Number of volumes configured to cluster.
I/O Summary
I/O summary is gathered from NameNode. It has a pie chart which shows total file reads versus total file writes.
- Total Bytes Read: Total number of bytes read.
- Total Bytes Written: Number of bytes written by user.
- Total Blocks Read: Total number of blocks read.
- Total Blocks Written: Number of blocks written to DataNode.
- Total File Read: Number of files read.
- Total File Written: Number of file writes.
- Total File Appended: Number of files appended on cluster.
- Total File Renamed: Number of files renamed on cluster.
- Total List File Ops: Number of list file operations.
- Total Delete File Ops: Number of file delete operations.
NameNode Summary
It displays certain attributes about the NameNode in the cluster in a tabular form. Summary attributes are:
- NameNode: Unique Identifier and IP address of the NameNode.
- Type: Type of the NameNode i.e Active or StandBy.
- JVM Heap: The Java virtual machine heap is the area of memory used by the JVM, for dynamic memory allocation.
- File Reads: Number of read operations performed on cluster.
- File Writes: Number of write operation performed on cluster.
- Alerts: Alerts are generated when rules defined by user violates. It displays number of alerts generated.
- CPU Usage: Memory usage of NameNode system.
- RAM: Amount of random access memory available at NameNode.
- N/W Rcvd: Rate of data received on network in bytes/s.
- N/W Sent: Rate of data sent on network in bytes/s.
- Disk Reads: Rate of data written to disk in bytes/s.
- Disk Writes: Rate of data read from disk in bytes/s.
- Safemode: Safemode status as On or Off.
- Status: State of the NameNode i.e started or stopped.
- Monitoring: State of NameNode monitoring i.e. whether NameNode monitoring is started or stopped or not responding.
DataNode Summary
It displays certain attributes about the DataNode in a tabular form. It displays information about all the DataNodes in the cluster.
Summary attributes are:
- DataNode: Unique Identifier and IP address of the DataNode.
- Rack Name: Name of the rack in which DataNode is present.
- JVM Heap: The Java virtual machine heap is the area of memory used by the JVM, for dynamic memory allocation.
- Volume: Local repository of DataNode on that host.
- Disk: Label of the hard disk on which volume is mounted.
- Size: Total storage space available on DataNode.
- Usage %: Percentage of disk used.
- Bytes Read: Number of bytes read from DataNode.
- Bytes Written: Number of bytes written to DataNode.
- Alerts: Alerts are generated when rules defined by user violates. It displays number of alerts generated.
- CPU Usage: Memory usage of DataNode system.
- RAM: Amount of random access memory available at DataNode.
- N/W Rcvd: Rate of data received on network in bytes/s.
- N/W Sent: Rate of data sent on network in bytes/s.
- Disk Reads: Rate of data written to disk in bytes/s.
- Disk Writes: Rate of data read from disk in bytes/s.
- Status: State of the DataNode i.e started or stopped.
- Monitoring: State of DataNode monitoring i.e. whether DataNode monitoring is started or stopped or not responding.
Copyright © 2018 QueryIO Corporation. All Rights Reserved.
QueryIO, "Big Data Intelligence" and the QueryIO Logo are trademarks
of QueryIO Corporation. Apache, Hadoop and HDFS are trademarks of The Apache Software Foundation.
